A new interactive data tool created by the UN University Centre for Policy Research, which shows a mismatch between where modern slavery occurs, and where governments are spending resources to address it, could help make a positive impact on policy debates surrounding the issue.
The release of Modern Slavery Data Stories, a series of easily understandable animated graphics, provides detailed pictures of the ways that factors related to modern slavery have changed over time, and comes during a period when over 40 million people are living in slavery, more than ever before in human history.
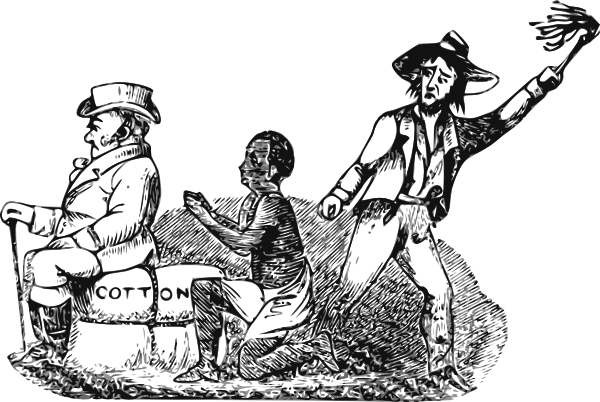
UN-led research shows that half of those enslaved are victims of forced labour in industries such as farming, mining and domestic service, while the rest are victims of sex slavery, forced marriage slavery and child slavery.
According to the latest Global Slavery Index, published by the Walk Free Foundation, the three countries with the highest prevalence of modern slavery are North Korea, Eritrea and Burundi.
Modern Slavery Data Stories are developed by Delta 8.7, an innovative project from the United Nations University’s Centre for Policy Research, in collaboration with technologists from the prestigious Carnegie Mellon University in the US, to help policy-makers understand and use data , in order to create effective legislation.
In an exclusive interview with UN News, Dr James Cockayne, Director of the Centre for Policy Research, and head of Delta 8.7, says that eradicating slavery by 2030 would require freeing around 9,000 people every day, a rate far higher than that currently being achieved.
One of the ways to get there, says Dr Cockayne, is to break down this complex phenomenon and present it in ways that influential non-experts can comprehend. Because data on these subjects has been so patchy, he says, this story has been difficult to tell, so Delta 8.7 built a machine-learning algorithm, which scoured official aid programme descriptions to figure out which countries committed how much, to tackle which forms of exploitation, when and where.
This is how his team discovered the mismatch between where modern slavery occurs, and where governments are spending resources to address it- “That kind of insight, made obvious through these powerful visuals, can have a real impact on policy debates.” (UNI)