CSE Analysis: Irrespective of their diverse geographic and climatic contexts, the megacities of India – Delhi, Mumbai, Kolkata, Bengaluru, Hyderabad and Chennai — have seen worsening PM2.5 levels during the winter of 2024-25 (October 1, 2024-January 31, 2025). The overall level and the peaking points of pollution have, however, varied across cities depending on the meteorological conditions of different climatic zones.
This has emerged from a new analysis of real time PM2.5 data in these cities during the winter period. The analysis, done by Centre for Science and Environment (CSE), has evaluated pollution trends in peer megacities and provides insights into long-term seasonal variations and annual shifts in particulate pollution during winter.
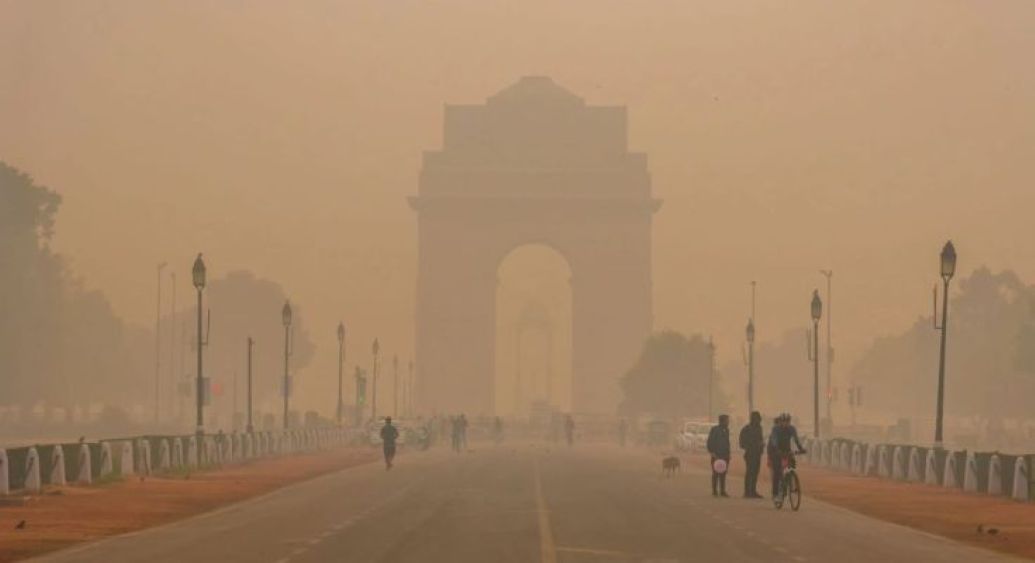
While Delhi, located in the land-locked Indo-Gangetic Plains (IGP) with adverse meteorology, has recorded the highest level of pollution during winter, Kolkata — also at the tip of the IGP – ranks second. The megacities outside the IGP — Mumbai, Chennai, Hyderabad and Bengaluru — despite having more advantageous climatic conditions and natural ventilation, have also experienced increases in average PM2.5 concentrations.
Other than Delhi and Chennai, all other megacities have recorded city-wide winter averages that are comparatively lower than the average of the past three winters; but the concentrations across different locations have been high, leading to high exposures.
The peaking of pollution during winter in any climatic zone is a sign of the underlying problem of persistent air pollution in these rapidly urbanising and motorising cities. The growing impact of local sources of pollution shows up in the pollution hotspots across these cities, increasing local exposures and risks,” says Anumita Roychowdhury, executive director, research and advocacy, CSE.
These cities need stringent action to curb pollution from all sources to meet the clean air standards. But urban centres like Delhi and Kolkata that face an additional challenge of adverse meteorology which enhances the concentrations, need even more stringent action to counter these effects,” Roychowdhury adds.
According to Sharanjeet Kaur, programme officer with the Urban Lab at CSE, “While Delhi’s winter air quality often dominates public discourse, rising pollution levels in other megacities remain largely overlooked. Despite some improvement in seasonal pollution trends, winter pollution continues to remain high or has been rising locally.”
The Methodology Behind the CSE Analysis
This is an assessment of annual and seasonal trends in PM2.5 concentrations for the period October 1 to January 31 in the years 2021-22, 2022-23, 2023-24, and 2024-25. Data points have been cleaned and data gaps addressed based on the USEPA method. The analysis has been done on the basis of real time data available from currently working air quality monitoring stations in Delhi, Kolkata, Mumbai, Chennai, Hyderabad and Bengaluru — 115 continuous ambient air quality monitoring stations (CAAQMS) have been covered. Delhi (40), Kolkata (seven), Mumbai (31), Hyderabad (14), Bengaluru (14) and Chennai (nine) have more than one real time station, therefore city-wide averages have been used for comparative analysis: it is defined as average of all city stations that have been functional for the given study period.
The Key Highlights Of The Analysis
During this winter, Kolkata and Hyderabad were most polluted after Delhi, while Mumbai, Chennai and Bengaluru saw the fastest worsening of localised pollution levels : Delhi, with a winter average PM2.5 level of 175 microgramme per cubic metre (µg/m³) remains the most polluted megacity by a large margin during winter, even though the winter average has shown improvement over the previous winter.
In the other five megacities, the average winter PM2.5 level was 65 µg/m³ in Kolkata; 52 µg/m³ in Hyderabad; 50 µg/m³ in Mumbai; 36 µg/m³ in Chennai; and 37 µg/m³ in Bengaluru. Kaur points out that winter averages cannot be directly compared with a 24-hour average or an annual average. She says: “Indicatively, daily standards for PM2.5 are 60 µg/m³ and annual standards are 40 µg/m³. But city average is not an adequate indicator for high exposures in these cities.”
Worst affected locations within megacities have pollution levels 19-60 per cent higher than citywide averages: There is considerable variation in air quality among locations in each megacity, with worst locations being considerably more polluted than the city-wide averages. In Kolkata and Mumbai, for instance, the worst air quality was recorded at Ballygunge and Deonar respectively, where the seasonal average stood at 80 µg/m 3 .
Notably, four of the six most polluted locations among the 68 monitoring stations across five megacities were in Mumbai, while the remaining two were in Kolkata. IDA Pashamylaram was the most polluted location in Hyderabad, with the seasonal average at 62 µg/m³. In Bengaluru, the most polluted location was RVCE — its seasonal average was 56 µg/m³. Alandur was the most polluted location in Chennai, with a seasonal average of 47 µg/m³ .
When compared to the citywide average, pollution levels in the worst-affected locations within each megacity were significantly higher. Chennai saw a 30 per cent increase, while Bengaluru recorded a 51 per cent rise. Mumbai experienced the highest disparity, with pollution levels 60 per cent higher than the citywide average. In Hyderabad, the worst-affected location had 19 per cent higher pollution, whereas Kolkata and Delhi recorded increases of 23 per cent and 30 per cent, respectively.
Longer-term trend in winter averages in mega cities : When compared to the three-year average, Delhi remained the worst performer, with average winter pollution levels continuing to rise, even though by just 1 per cent higher than the average of the last three years.
Compared to the winter of 2021-22, Mumbai, Kolkata and Hyderabad show improvement with their winter PM2.5 levels dropping by 16 per cent, 14 per cent and 16 per cent respectively. Delhi has recorded a 7 per cent reduction in pollution levels compared to the pervious winter, but 5 per cent higher than in 2021-22. Meanwhile, Bengaluru and Chennai have recorded an increase in PM2.5 levels compared to 2021-22, reflecting a worsening trend in air quality.
Peak winter pollution in Delhi hits worst level in last four years; other cities indicate varying trends: Delhi recorded its highest daily PM2.5 level in four years, with pollution spiking to 602 µg/m³ on November 18, 2024 — the steepest 24-hour average since 2021. This marks a 65 per cent increase from last winter’s peak and is 42 per cent higher than the city’s three-year average, highlighting a worsening pollution trend in the capital.
Kolkata and Chennai showed little improvement, with Kolkata’s maximum peak level of PM2.5 stagnating at 135 µg/m³, while Chennai saw a slight reduction from 147 µg/m³ last winter to 119 µg/m³ this year.
In contrast, Hyderabad, Mumbai and Bengaluru recorded reductions in peak/maximum winter pollution levels. Hyderabad showed the most improvement in peak levels, with a 51 per cent drop in PM2.5 levels, down to 89 µg/m³ from 183 µg/m³ last year. Bengaluru followed with a 42 per cent decline, reducing peak levels to 67 µg/m³, while Chennai saw a 19 per cent improvement and Mumbai recorded a 12 per cent drop in its peak level, lowering its PM2.5 from 92 µg/m³ to 81 µg/m³.
This winter’s peak daily pollution levels in Kolkata, Chennai and Hyderabad were lower than their previous winter peaks, but still fell under the “poor” AQI category. Kolkata’s winter peak stood at 135 µg/m³ registered on November 2, 2024; for Chennai, it stood at 119 µg/m³ registered on October 31, 2024; and for Hyderabad it stood at 89 µg/m³ registered on November 25, 2024.
Monthly air quality pattern varies across the megacities: Air pollution trends differ across India’s megacities, with Delhi and Hyderabad experiencing their worst air quality in November, while other cities saw peak pollution in December and January. January emerged as the most polluted month for Kolkata, Bengaluru and Chennai, with air quality deteriorating further compared to previous months. Mumbai, on the other hand, recorded its worst pollution levels in December.
Winter is problematic season for all megacities, but the intensity of the problem varies : The days with bad air quality occurred in clusters during the winter season in the megacities. The clustering of bad air days was longer in Delhi, Kolkata and Mumbai, but of shorter duration in Hyderabad, Bengaluru and Chennai. The intensity and duration of these bad air days were long enough in Delhi to get classified as a smog episode.
Kolkata registers high number of ‘poor’ AQI days; Delhi remains the worst: Kolkata’s long-term seasonal PM2.5 trend was lower, but it recorded the same number of ‘poor’ air quality days as Delhi. With 15 days of ‘poor’ AQI, Kolkata matched Delhi’s count and also experienced one day of ‘very poor’ AQI. Among the megacities, Chennai had only one day of ‘poor’ AQI, while Mumbai, Bengaluru and Hyderabad recorded zero ‘poor’ AQI days .
In terms of cleaner air, Mumbai had only 19 days of ‘good’ AQI, followed by Kolkata with just 11 — the lowest among megacities (excluding Delhi). In contrast, Hyderabad (21 days), Bengaluru (44 days) and Chennai (55 days) recorded higher number of ‘good’ AQI days.
Delhi remained the most polluted megacity, registering eight days of ‘severe+’ AQI, 12 days of ‘severe’ AQI, 68 days of ‘very poor’ AQI, and no ‘good’ AQI days this winter.